

Modeling and Thermal Bridging
If you are using a performance based design method or beyond-code strategy in your design, energy modeling is a requirement. How much does the thermal envelope performance dictate the overall building efficiency? How sensitive is the whole building energy efficiency to thermal bridging?
Aside from air leakage due to poorly designed or installed air barrier details, heat flow through the thermal envelope is the summation of fenestration U values and wall, roof and foundation U values. Wall, roof and foundation U values are a summation of their clear field U values and any heat loss due to thermal bridges. The most accurate way to determine an assembly’s clear field U value and the heat loss due to thermal bridging is thermal modeling.
The primary benefit of modeling interface and transition details is accuracy. Whether you’re using COMcheck, REScheck WUFI or whole building energy modeling to determine building envelope performance, heat losses due to thermal bridging should be accounted for. This means the R values and U values used as inputs in these software programs should be corrected, effective values.
Simply adding the R values of all of the material components together or using area weighted averaging to account for a thermal bridge yields a misleading result. Why? Heat flows in three dimensions, especially when using highly conductive construction materials. The flow is not parallel, making simple math inaccurate.
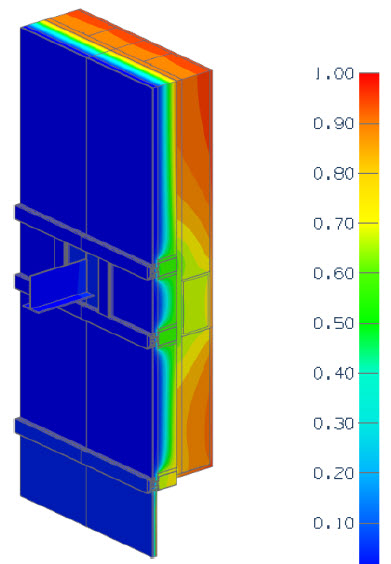
Image credit: Morrison Hershfield BETBG, Appendix B, Catalogue Material Data Sheets (Version 1.3)
Three dimensional heat flow at curtain wall mullion connections and sun shade beam connection
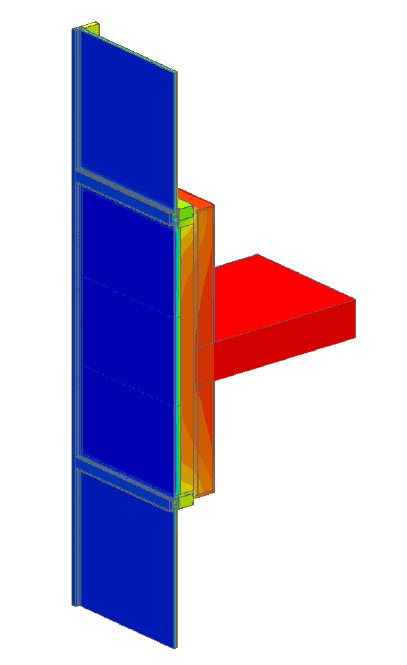
Image credit: Morrison Hershfield BETBG, Appendix B, Catalogue Material Data Sheets (Version 1.3)
Three dimensional heat flow at curtain wall mullion connections in wall spandrel area.
Design performance modeling prior to whole building energy modeling helps design teams to evaluate options and prioritize energy saving measures. As part of the early design stage evaluation process, thermal modeling will quantify thermal bridging heat loss and provide more accurate assembly U values.

Thermal modeling has revealed, much like the effects of steel stud framing, that masonry shelf angles and steel Z girts, for example, can reduce the R value of a wall assembly by as much as 50%.
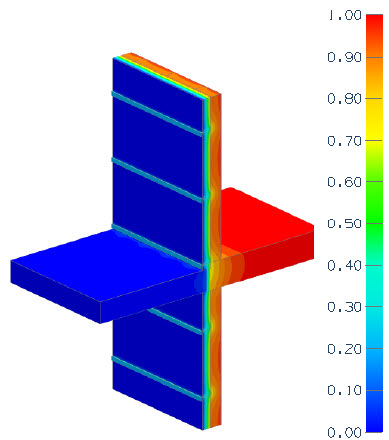
Image credit: Morrison Hershfield BETBG, Appendix B, Catalogue Material Data Sheets (Version 1.3)
Thermal model of wall cladding using metal attachments and concrete floor to balcony transition. Note the cooler temperatures at or behind the exterior sheathing due to thermal bridging.
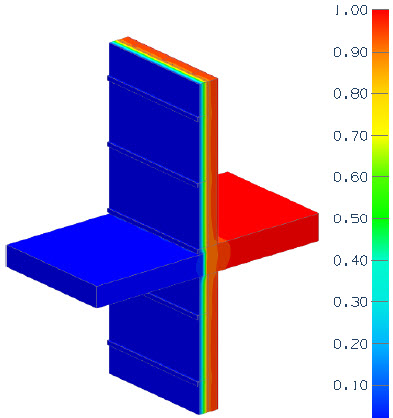
Image credit: Morrison Hershfield BETBG, Appendix B, Catalogue Material Data Sheets (Version 1.3)
Same thermal model with thermal breaks installed at cladding attachments and concrete balcony. Note the colder temperatures are now located outside of the exterior sheathing.
In modeling, thermal bridges are characterized as “point” or “linear.” Point thermal bridges are discrete connection points such as canopy, balcony or roof screen posts. Linear thermal bridges are defined by length. Shelf angles, parapets and wall transitions are examples. Wall and roof assemblies are modeled with and without the thermal bridging features. This results in a more accurate clear field U value and an adjusted, effective U value for the assembly, which includes the impact of heat loss by the thermal bridge.
What if the effective U value does not meet code? The model can be used to explore the effectiveness of various thermal break solutions. Manufacturers of thermal break materials and systems publish the thermal conductivity and/or R values of their products. These values are assigned to thermal break components in the revised model, and an optimum thermal break solution can be determined.
Aside from lower than assumed R values, thermal bridges that are not addressed can also cause another problem – moisture. In addition to the degree of heat loss, thermal modeling will also indicate the temperature of material surfaces within the thermal envelope due to thermal bridging. This is useful in determining whether condensation is a risk by comparing the surface temperatures to the dew point. Thermal breaks also help to keep surface temperatures that are below the dew point on the outside of the thermal envelope.